ËÐÊ-1_ëîãî


Airborne gamma-survey after the Chernobyl accident. 1986.

Measurements of atmospheric noble radioactive gases (Kr, Xe).

Air-borne gamma-spectrometry systems

Construction materials radiation characteristics data base.

Multi-detector low-background gamma-spectrometer.


ENVIRONMENT SAMPLES RADIOACTIVITY INVESTIGATION MULTI-DETECTOR LOW-BACKGROUND GAMMA-SPECTROMETRY

One of the main techniques used today for environment radionuclides content analyses is the semiconductor detector low-background spectrometry. Using modern instrument base the above-mentioned technique ensures necessary sensitivity and precious measurements and satisfies high efficiency measuring procedures demand.

Low-background spectrometer.

This photo shows general view of the spectrometer used for above-mentioned research in Laboratory of Environmental Radioactivity “LRK-1 MEPhI”. Spectrometer is used for environment samples radionuclide content and activity measurement with HPGe low-background gamma-spectrometry. The spectrometer is placed in the semi-basement ventilated room.
The pectrometer includes 7 individual spectrometry channels (ISC), the accumulation, processing and result visualization device based on the NOKIA LP-4900B pulse height analyzer with software control, result processing device based on the PC.
Each ISC includes the following essentials:

  • Detector unit based on the semiconductor detector CANBERRA GL3830 and GL13021 in 7935-7S low-background cryostats (with the "CANBERRA" updating) and ORTEC GEM30185 normal type (not low-background) detector; all detectors are placed in passive low-background protective chambers;
  • BUI-3K, BUI-7, ORTEC-572 or ORTEC-672 linear spectrometry amplifier;
  • BPNV-89V or ORTEC-459 type high-voltage power unit;
  • 8-inputs analog multiplexer (common to all ISC);
  • 13-bit DAC LPD-4911.4 (common to all ISC).

Linear amplifier and high-voltage power units placed in "Vector VBC2-90", ORTEC 401 or ORTEC 4001 crates.
As a matter of fact, low-background shield embodies the modular principle and includes:

  • external protective shell (common lead; wall thickness 100 mm);
  • internal modules (low-background lead; wall thickness 20 - 40 mm);
  • internal shell coating (copper; thickness 5 - 15 mm);
  • the hood (same as external protective shell).

Different types internal modules makes possible to place different forms measuring containers in the chamber and use different types detectors.
Lifting mechanism allows access inside the shield when sample changing, internal modules changing and detector withdrawal.
Protective chamber with detector weight is not in excess of 600 kg; overall dimensions including cover opening/shifting space: 0,6õ0,8õ1,3 m (WxDxH).
Air-pressure plugging flow technique is used for liquid nitrogen filling in: nitrogen from external reservoir is dispensed by tube inserted in the Dewar neck or detector cryostat inlet connection. In the external reservoir free space the air is pumped.
For 226Ra radionuclide daughter part gamma-radiation background reduction, the protective chamber internal space is constantly blown with liquid nitrogen steam.
Researched samples are placed into cylinder containers with volume 145 cm3 (95õ30 mm in diameter) or 250 cm3 (95õ50 mm in diameter), or into Marinelly configuration container 500 cm3 or 1000 am3 in volume. In the both cases the containers are placed in fixing arm that ensures “sample - detector” geometry.

Some spectrometry background characteristics are presented below.


ORTEC GEM 30185-p+ backgr. spectrum.
Meas.date 10.04.96. Òmeas = 144 hours.


Canberra GL3830 backgr. spectrum.
Meas.date 23.05.96. Òmeas = 197 hours.


Nuclide

Energy, keV

Count rate, 1/ksec


Nuclide

Energy, keV

Count rate, 1/ksec

1.

Ra-226

185.97

3.09

±

0.45


1.

Ra-226

185.97


<

0.25

2.

Th-232

238.63

2.36

±

0.29


2.

Th-232

238.63


<

0.16

3.

Th-232

240.99


<

0.27


3.

Th-232

240.99


<

0.16

4.

Ra-226

241.97


<

0.29


4.

Ra-226

241.97


<

0.16

5.

Ra-226

295.22


<

0.31


5.

Ra-226

295.22


<

0.14

6.

Th-232

338.33

0.44

±

0.15


6.

Th-232

338.33


<

0.17

7.

Ra-226

351.92

0.33

±

0.21


7.

Ra-226

351.92


<

0.13

8.

Th-232

463.01


<

0.22


8.

Th-232

463.01


<

0.13

9.

Annihil

511.00

6.88

±

0.35


9.

Annihil

511.00

4.52

±

0.27

10.

Pb(n,n')

569.60

0.42

±

0.10


10.

Pb(n,n')

569.60


<

0.16

11.

Th-232

583.19

0.87

±

0.18


11.

Th-232

583.19

0.14

±

0.10

12.

Ra-226

609.32

0.31

±

0.13


12.

Ra-226

609.32


<

0.18

13.

Cs-137

661.66

0.26

±

0.15


13.

Cs-137

661.66


<

0.09

14.

Cu(n,n')

669.60

0.22

±

0.16


14.

Cu(n,n')

669.60


<

0.10

15.

Th-232

727.33

0.21

±

0.11


15.

Th-232

727.33


<

0.07

16.

U-238

766.60


<

0.17


16.

U-238

766.60


<

0.07

17.

Th-232

794.94

0.11

±

0.10


17.

Th-232

794.94


<

0.11

18.

Pb(n,n')

803.10

0.30

±

0.12


18.

Pb(n,n')

803.10


<

0.11

19.

Fe + n

847.00


<

0.09


19.

Fe + n

847.00


<

0.07

20.

Th-232

860.56

0.16

±

0.10


20.

Th-232

860.56


<

0.07

21.

Th-232

911.21

0.32

±

0.11


21.

Th-232

911.21


<

0.07

22.

Cu(n,n')

962.10

0.16

±

0.10


22.

Cu(n,n')

962.10


<

0.10

23.

Th-232

964.76


<

0.10


23.

Th-232

964.76


<

0.10

24.

Th-232

968.97

0.13

±

0.10


24.

Th-232

968.97


<

0.09

25.

U-238

1001.00

0.22

±

0.10


25.

U-238

1001.00


<

0.06

26.

Cu(n,n')

1115.50


<

0.17


26.

Cu(n,n')

1115.50


<

0.08

27.

Ra-226

1120.31


<

0.14


27.

Ra-226

1120.31


<

0.06

28.

Co-60

1173.20

0.09

±

0.09


28.

Co-60

1173.20


<

0.09

29.

Co-60

1332.50


<

0.11


29.

Co-60

1332.50


<

0.07

30.

K-40

1460.80

0.57

±

0.09


30.

K-40

1460.80

0.12

±

0.05

31.

Ra-226

1764.55

0.18

±

0.05


31.

Ra-226

1764.55


<

0.05

32.

Ra-226

2204.17

0.08

±

0.07


32.

Ra-226

2204.17


<

0.06

33.

Ra-226

2447.84


<

0.08


33.

Ra-226

2447.84


<

0.05

34.

Th-232

2614.53

0.46

±

0.07


34.

Th-232

2614.53

0.08

±

0.07


Continuum intensity, counts/keV/ksec


Continuum intensity, counts/keV/ksec


1.

100 keV

2.489

±

0.015


1.

100 keV

1.170

±

0.009


2.

200 keV

2.422

±

0.015


2.

200 keV

1.253

±

0.009


3.

300 keV

1.426

±

0.012


3.

300 keV

0.735

±

0.007


4.

400 keV

0.849

±

0.009


4.

400 keV

0.461

±

0.006


5.

500 keV

0.635

±

0.008


5.

500 keV

0.406

±

0.005


6.

600 keV

0.411

±

0.006


6.

600 keV

0.250

±

0.004


7.

700 keV

0.313

±

0.005


7.

700 keV

0.206

±

0.004


8.

800 keV

0.239

±

0.005


8.

800 keV

0.153

±

0.003


9.

1000 keV

0.165

±

0.004


9.

1000 keV

0.105

±

0.003


10.

1200 keV

0.121

±

0.003


10.

1200 keV

0.083

±

0.002


11.

1500 keV

0.086

±

0.003


11.

1500 keV

0.054

±

0.002


12.

2000 keV

0.053

±

0.002


12.

2000 keV

0.037

±

0.002


13.

2500 keV

0.035

±

0.002


13.

2500 keV

0.028

±

0.001


Measurement control software designed for LP-4900B analyzer allows:

  • independently start and stop each of 7 ISC' measurement;
  • collect spectrometry information of 4096 channels per spectrum for 7 spectra in amplitude analysis live-time mode;
  • display spectrometry and control information in real time;
  • user input of information necessary for measurement identification;
  • input and output measurement results from/to IBM formatted floppy.

Sample measurement time necessary for representative spectrum and determined with its activity, type, radionuclide content and solved task is usually 2 – 60 hours. To ensure spectrometry information will be kept safe during long-term measurement the partial spectra are stored on the floppy each 1-4 hours (depends on the whole measurement duration). Beside that, such redundancy gives the operator opportunity (without influence to or stopping current measurement) to perform earlier measured spectra summation providing common energy calibration. That is equal to ISC transformation factor periodic correction.
Resulting spectrum accumulated during sample measurement time (or obtained by operator with corrected or not partial spectra manual summation) is provided with sample name, date and measurement time information. This total spectrum is stored on floppy disk and transferred to PC for next processing. As well spectrum can be transmitted from analyzer to PC by communication line using parallel port.
The software designed for quantitative analysis of the spectrometry results includes 3 parts:

  • interactive spectra processing;
  • sample radionuclide content calculation using gamma-spectrometry analysis results;
  • data set preparation necessary for analysis.

1. Interactive spectra processing. Spectrum processing objective is count rate and other parameters measurement and their errors evaluation for full energy absorption peak. Processing starting data are measured spectrum, sample and its measurement condition information, spectrometry characteristics, radionuclides and their gamma-radiation data library. The processing is interactive. Processing executing operator is guided by spectrum view and gamma-radiation lines table with software help. Operator can control view type, choose single peaks or peak groups for analysis, give or correct peaks and peaks groups limits chosen by software, identify peaks or correct the peak identification provided. The algorithms used in program give opportunity to measure single peaks areas and FWHM, execute multiplets resolution with position and area components measurement, estimate peak area upper limit (for peaks included in the table, but not found in spectrum). During the processing energy calibration is tuned automatically to the given spectrum. For all measured parameters both statistic and systematic errors are estimated.

2.Sample radionuclide content calculation. The given list sample radionuclide content measurement is executed with using peaks count rates measured during spectrum processing. After background count rates subtraction and sample density correction using spectrometer sensitivity (peak count rate divided by sample activity) values library for each gamma-radiation line radionuclide activity or its upper limit estimation are calculated using all lines averaging. Using received results measurement protocol is prepared, where sample characteristics and measurement condition are described and sample radionuclide specific activity values are given in units of Bk/kg for sampling date. If the sample is characterized by definite surface, then specific activity values in units of Bk/m2 are given, if by volume – then in units mBk/cm3. For soil depth layer-by-layer selection sample measurement results analysis the program has been designed that approximate depth specific activity distribution with one or two exponential curves measuring distribution parameters and soil radionuclide reserve activity. Radionuclides activity errors are calculated by used data systematic errors (sensitivity and efficiency calibration sample sources characteristics, samples own uptake correction parameters etc.) and by spectrum statistics and are between 5 and 15%. Processing results protocol examples are on pictures 4, 5.

3.Analysis data set preparation. For above described operations execution the following data are necessary:

  • background count rates for gamma-lines to be analyzed
  • these lines sensitivity values,
  • FWHM peak dependence on energy for multiplet resolution,
  • source own uptake correction parameters.

Auxiliary software is designed for these values calculation and their introduction in data processing.

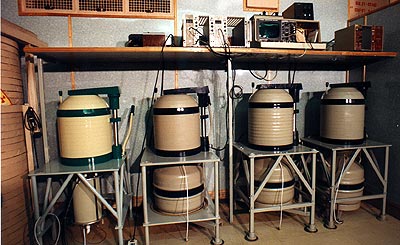
3.1. Background count rates are measured by experimental background spectra measured at regular intervals for each ISC using processing program measurement control software and put down in corresponding data set for each ISC.

3.2. Each "detector + sample container" combination efficiency calibration is executed for sensitivity values measurement. The calibration includes determination of values and errors for full energy absorption peaks efficiency analytical dependence on gamma-quantum energy using sample sources measurement results. For coincided with used sample sources list radionuclides (137Cs, 134Cs, 226Ra, 232Th, 40K, 57Ñî, 54Mn, 22Na, 65Zn, 139Ce, 113Sn, 152Eu) sensitivity values are measured by sample sources measurement results averaging, for other radionuclides – by measured efficiency (using sized curve) for each gamma-line quantum yield.

3.3. FWHM dependence on energy is measured using the same sample sources measurements and approximated by linear function.

3.4. To adjust efficiency dependence on sample density and gamma-quantum energy correction coefficient analytical dependence is used. This dependence's parameters are measured by least squares technique for each "detector + container" combination using 226Ra spectra from samples with density between 0.2 and 2.5 g/cm3.

Received by this strategy data are kept in individual file for each "detector+shield+container" set and used during spectrum processing and sample radionuclide content measurement.

To ensure accumulation technique and data processing accuracy the test samples 137Cs, 232Th and 152Eu content measurement was executed. These samples were provided by NIKIET in the context of "RF Ministry of Nuclear Power factories gamma-spectrometry metrology expert examination" program. Specific activities received estimations to their certificate value ratio are:

137Cs: 1.01 ± 0.05; 232Th: 0.95 ± 0.09; 152Eu: 1.02 ± 0.10


Example 1:Spectrometry analysis data-processing protocol.

MOSCOW ENGINEERING PHYSICS INSTITUTE
LABORATORY OF ENVIRONMENTAL RADIOACTIVITY (LRK-1 MEPhI)
«LRK-1 MEPhI» Laboratory is registered in the State Registry and numbered as ¹41004-93/03.

Sample......................

KV-249

location....................

Goluboy Log

sampling date...............

1995 9 14

sample material.............

vegetation

initial sample mass..........

225.0 g

prepared sample mass........

200.0 g

packeting date..............

1995 11 1

container...................

A3 250.0 cub.cm

instance mass...............

124.0 g

instance density............

0.496 g/cub.cm

measurement date............

1996 4 3

detector....................

D5A DGDK-261-2.30

shield......................

S5A configuration for containers A1,A3

exposition..................

180.85 hour

spectrum....................

KV-249R3


Radionuclides content on sampling date


ash

air-dried sample


Bk/kg

Bk/kg


Cs-137

28.7

±

1.6

25.5

±

1.4


Cs-134

6.08

±

0.55

5.41

±

0.49


Ru-103


<

6.0


<

5.3


Ru-106


<

2.4


<

2.1


Ce-141


<

17


<

15


Ce-144


<

3.1


<

2.8


Sb-124


<

3.8


<

3.4


Co-60

14.36

±

0.86

12.77

±

0.76


Mn-54

55.1

±

3.0

49.0

±

2.6


Fe-59

106.6

±

9.7

94.7

±

8.6


Cr-51


<

199


<

176


Co-58

16.3

±

1.5

14.5

±

1.3


Zr-95

4.7

±

4.0

4.2

±

3.6


Zn-65

1.14

±

0.57

1.01

±

0.51


Sc-46

0.88

±

0.62

0.78

±

0.56


Be-7

140

±

22

124

±

19


K-40

254

±

14

226

±

13


Ra-226

13.1

±

1.2

11.7

±

1.0


Th-232

11.5

±

1.6

10.2

±

1.4


U-238

35

±

21

31

±

19


Example 2:Spectrometry analysis data-processing protocol.

MOSCOW ENGINEERING PHYSICS INSTITUTE
LABORATORY OF ENVIRONMENTAL RADIOACTIVITY (LRK-1 MEPhI)
«LRK-1 MEPhI» Laboratory is registered in the State Registry and numbered as ¹41004-93/99.


Sample......................

NVN-509 underlay

location....................

16

sampling date...............

1996 6 22

sample material.............

vegetation

initial sample mass..........

708.0 g

prepared sample mass........

268.0 g

sample surface area.........

2500.0 sq.cm

packeting date..............

1996 7 1

container...................

A3 250.0 cub.cm

instance mass...............

90.0 g

instance density............

0.360 g/cub.cm

measurement date............

1996 7 26

detector....................

D5A GEM 30185-p-plus

shield......................

S5A configuration for containers A1,A3

exposition..................

63.58 hour

spectrum....................

NVN-509


Radionuclides content on sampling date


ash

air-dried sample


Bk/kg

Bk/kg

Bk/sq.m


Cs-137

4081

±

218

1545

±

82

4374

±

233


Cs-134

81.5

±

4.5

30.9

±

1.7

87.4

±

4.9


Ru-103


<

2.1


<

0.79


<

2.2


Ru-106


<

7.5


<

2.8


<

8.0


Ce-141


<

2.4


<

0.91


<

2.6


Ce-144


<

12


<

4.6


<

13


Sb-124


<

4.3


<

1.6


<

4.6


Sb-125

16.0

±

2.7

6.1

±

1.0

17.1

±

2.9


Eu-154

6.10

±

0.79

2.31

±

0.30

6.54

±

0.84


Co-60

23.2

±

1.3

8.79

±

0.50

24.9

±

1.4


Mn-54

3.49

±

0.48

1.32

±

0.18

3.74

±

0.51


Fe-59


<

0.99


<

0.37


<

1.1


Cr-51


<

27


<

10


<

29


Co-58


<

0.64


<

0.24


<

0.68


Zr-95

1.12

±

0.62

0.42

±

0.23

1.20

±

0.66


Zn-65


<

0.71


<

0.27


<

0.76


Sc-46


<

0.60


<

0.23


<

0.65


Be-7

181

±

23

68.4

±

8.5

194

±

24


K-40

156

±

11

59.0

±

4.1

167

±

12


Ra-226

10.4

±

1.2

3.92

±

0.45

11.1

±

1.3


Th-232

9.5

±

1.1

3.61

±

0.41

10.2

±

1.2


U-238


<

136


<

51


<

145


Back to previous page...


Return to the homepage...